Image Sampling |
||||||||||||||||||||||||||||||
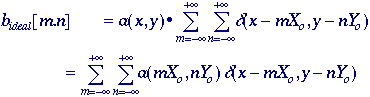
| Converting
from a continuous image a(x,y) to its digital
representation b[m,n] requires the process of
sampling. In the ideal sampling system a(x,y) is
multiplied by an ideal 2D impulse train:
where
Xo and Yo are the sampling distances
or intervals, d(*,*)
is the ideal impulse function, and we have used eq. . (At some point, of
course, the impulse function d(x,y) is converted to the
discrete impulse function d[m,n].) Square sampling
implies that Xo =Yo. Sampling with
an impulse function corresponds to sampling with an infinitesimally
small point. This, however, does not correspond to the usual situation
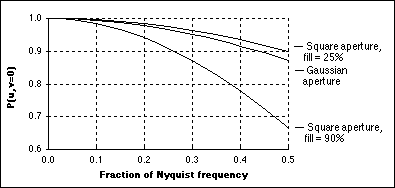
as illustrated in Figure 1. To take the effects of a finite
sampling aperture p(x,y) into account, we can
modify the sampling model as follows:
The
combined effect of the aperture and sampling are best understood by
examining the Fourier domain representation.
where
|
|
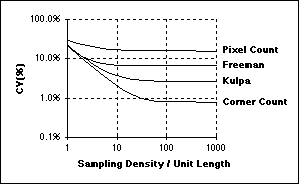
Coefficients
|
a |
|
|
|
|
Formula |
|
|
|
Reference |
|
Pixel count |
1 |
1 |
0 |
[18] |
|
Freeman |
1 |
|
0 |
[11] |
|
Kulpa |
0.9481 |
0.9481
*
|
0 |
[20] |
|
Corner count |
0.980 |
1.406 |
-0.091 |
[21] |
Table 7: Length estimation formulas based on chain code counts (Ne, No, Nc)
Conclusions on sampling
If one is interested in image processing, one should choose a sampling density based upon classical signal theory, that is, the Nyquist sampling theory. If one is interested in image analysis, one should choose a sampling density based upon the desired measurement accuracy (bias) and precision (CV). In a case of uncertainty, one should choose the higher of the two sampling densities (frequencies).